Your Search Console graph looks fine. Clicks are up a little on last quarter, and the team shipped a dozen new posts. Then sales asks why demo requests from organic have dropped.
The new posts are hiding the problem. A handful of pages that used to carry your pipeline have been sliding for a year, a position or two at a time. Site-wide totals don’t show it, because fresh content keeps filling the hole the old content leaves.
That slow leak is content decay. This guide shows you how to spot it in Google Search Console, how to measure it without getting fooled by two random dates, and how to decide which pages to refresh, merge, redirect, or retire.
In short:
- Content decay is a slow, page-level loss of clicks, rankings, or visibility on a page that used to perform. Site-wide growth can hide it.
- Rule out lookalikes first. Algorithm updates, technical changes, seasonality, and your own edits all look like decay but need different fixes.
- Measure the trend, not two points. A monthly slope tells you what’s actually decaying. A single before-and-after comparison can show growth on a page that’s been falling all year.
- Diagnose the type before you fix it. Ranking, click, intent, freshness, cannibalization, link, and demand decay each leave a different fingerprint in Search Console.
- Fix the pages closest to revenue first, keep the URL, save a baseline, and only change the date when the content really changed.
What is content decay?
Content decay is the gradual loss of organic clicks, rankings, or search visibility on a page that used to perform well. It happens over months, one page at a time, as competitors publish better pages, search intent shifts, facts go stale, or the results page changes around you. It’s not a penalty, and it’s not a sudden drop.
Every page that ranks goes through roughly the same life. It gets indexed and climbs. It peaks. Then it plateaus, and the plateau is where decay starts, quietly, while the traffic graph still looks flat. Most teams put all their effort into the climb and almost none into the slide.
The speed and scope tell you whether you’re looking at decay or something else:
| Content decay | Algorithm update | Technical issue | |
|---|---|---|---|
| Speed | Slow, over months | Sudden, over days | Sudden or step-shaped |
| Scope | Individual pages | Many pages or the whole site | One page, a template, or the whole site |
| Typical cause | Competitors, intent, stale facts, lost links | Google changing how it ranks results | noindex, redirect, canonical, robots.txt, outage |
| First check | The page’s own query data | Google’s ranking update history | Page indexing report and URL Inspection |
Speed and scope are the quickest way to tell slow decay apart from a sudden drop.
Decay now has a second dimension too. A page can hold its Google ranking and still drop out of AI Overviews, AI Mode, or ChatGPT answers. Those are separate visibility layers, so you track them separately.
The 7 types of content decay (and what each looks like in Search Console)
There are seven common types of content decay, and each one leaves a different pattern in Search Console. Get the type right, and the fix is usually obvious. Get it wrong, and you’ll rewrite a page that only needed a better title.
| Type | What happened | Search Console fingerprint | First fix |
|---|---|---|---|
| 1Ranking decay | Competitors published better pages or earned more links | Average position falls, impressions fall with it | Standard refresh |
| 2Click decay | AI Overviews, featured snippets, or other SERP features answer the query first | Position and impressions hold, CTR and clicks fall | Rewrite title, meta and opening answer |
| 3Intent decay | Google now favors a different kind of page for the query | Position drops on the main query, new unrelated queries appear | Rebuild in the format that now ranks |
| 4Freshness decay | Prices, features, stats, or screenshots are out of date | Gradual slide, worst on “best”, “pricing” and year-stamped queries | Light refresh |
| 5Cannibalization | A newer page on your site competes for the same queries | Clicks and rankings swap between two of your URLs | Merge and redirect |
| 6Link decay | Backlinks were lost or internal links were removed | Position slips on competitive queries with no content change | Reclaim and earn links |
| 7Demand decay | Fewer people search for the topic | Impressions fall on every query, position steady | No refresh. Merge, retire, or stop judging it on traffic |
Diagnose the type before you fix anything. Demand decay is the only type a refresh can’t fix.
Click decay is the one most teams misread. Your page didn’t get worse;e, the results page got crowded. In a Pew Research Center analysis of 68,879 Google searches from March 2025, users clicked a traditional result on 8% of visits when an AI summary appeared, against 15% when it didn’t. An Ahrefs study of 300,000 keywords using December 2025 data found an AI Overview was linked to a 58% lower click-through rate for the top-ranking page. A full rewrite won’t bring those clicks back. A sharper title and a reason to click through might.
Freshness decay depends on the query. Google says its “query deserves freshness” systems show fresher content where searchers would expect it. A definition page can sit untouched for years. A “best tools” list with last year’s pricing can’t.
Link decay is the type most guides skip. Pages earn rankings partly through links, and links go away. Sites redesign, posts get deleted, and someone on your own team removes a menu link during a redesign. If a page slides on a competitive query and nothing on the page changed, check its backlinks and internal links before you touch the copy.
Demand decay is the only type a refresh can’t fix. If impressions are falling across every query while your position holds, the searchers are leaving the market, not going to a competitor. Confirm it in Google Trends before you spend a day rewriting.
Rule these out before you call it decay
Before you treat a falling page as decay, rule out the drops that only look like it. A refresh won’t fix a stray noindex tag, and a rewrite during a core update rollout makes it impossible to tell what worked.
| Lookalike | How it shows up | Where to check |
|---|---|---|
| Algorithm update | Many pages drop within days of each other | Google’s ranking update history |
| Technical issue | One page or template falls off, often with impressions near zero | Page indexing report, URL Inspection, a crawl for noindex, canonical and redirect changes |
| Your own edit | Traffic fell after someone changed the page | CMS revision history, your change log |
| Site migration or URL change | Rankings wobble after URLs moved | Redirect map, Page indexing report |
| Seasonality | The same dip happened at the same time last year | Search Console set to 16 months, Google Trends |
| Reporting glitch | A sudden drop with no change on the site | Search Console’s data anomalies page |
| Tracking change | Search Console is steady but GA4 sessions fell | GA4 tag and consent setup |
Based on Google’s guide to debugging drops in Search traffic.
Google’s own guide to debugging traffic drops is a good reference here. Two details from it matter for decay work. A misplaced noindex causes a slower drop, because Google has to recrawl the page first, so a technical problem can look gradual. And Google recommends the 16-month view so you can see whether a dip happens every year.
The “your own edit” check is the one people skip. If traffic dropped right after a redesign, a new template, or a copy rewrite, the fix may be restoring what was removed, not refreshing what’s there.
How to find content decay in Google Search Console
You can find content decay for free in Google Search Console by comparing each page’s clicks over the last three months with the same three months a year earlier. It’s also the most accurate source you have, because the data comes from Google rather than a third-party estimate.
- Open Performance, choose Search results, and set the date filter to Compare.
- Pick Compare last 3 months year over year. A year-over-year view cancels out most seasonality, which matters for B2B sites that dip every December.
- Open the Pages tab and sort by Clicks difference, so the biggest losers sit at the top.
- Export the list and drop any page published less than 12 months ago. New pages haven’t settled yet, and they’ll swamp your list with noise.
- Click into each remaining loser and open the Queries tab. Note whether position, impressions, or CTR moved. That tells you the type, using the table above.
- Switch that page to the Last 16 months view to see the shape. A slow slope is decay. A cliff is something else. A dip that repeats every year is seasonality.
- Check the Search appearance, Devices, and Countries tabs. Sometimes the loss is only on mobile, or only in one market.
- Log every flagged page in a sheet with its URL, type, baseline numbers, and owner.
Two Search Console limits are worth knowing. First, it only keeps 16 months of data. If you want longer history, set up the bulk data export to BigQuery now, because you can’t backfill it later. Second, Google hides a large share of queries for privacy, so a page’s query list rarely adds up to its total clicks. When a decline doesn’t show up in any single query, trust the page-level trend.
How to measure content decay
Measure content decay with two numbers per page: the decay rate, which compares two periods, and the trend slope, which reads every month in between. The decay rate is quick. The slope is what stops you from being fooled.
Decay rate is the percentage change in clicks between two periods:
\text{Decay rate} = \frac{\text{Clicks}_{\text{current}} – \text{Clicks}_{\text{previous}}}{\text{Clicks}_{\text{previous}}} \times 100
A page that went from 1,200 clicks to 840 has a decay rate of minus 30%.
The problem is that two dates can lie. Take a page that peaked in month two and then slid for ten straight months, with one small bump at the end. Compare month 1 to month 12, and it looks like growth. Read all twelve months, and it’s clearly decaying.
Trend slope fixes that. Put a page’s last 12 monthly click totals in a row in Google Sheets, then divide the slope by the average so you can compare big and small pages on the same scale:
=SLOPE(B2:M2, B$1:M$1) / AVERAGE(B2:M2)
Row 1 holds the month numbers 1 to 12. The result is the average change per month as a share of the page’s typical traffic. Minus 0.03 means the page is losing about 3% of its usual clicks every month.
Here’s how the two methods disagree on three illustrative pages:
See what Reddit & SEO can do for your pipeline — grab a time
A 30-minute working session. We'll map your top intent gaps and where the pipeline is leaking. No pitch deck.
| Page | Month 1 clicks | Month 12 clicks | Two-point change | Slope per month | Verdict |
|---|---|---|---|---|---|
| A, comparison pageHidden decay | 600 | 620 | +3% | -3.0% | Decaying, hidden by a late bump |
| B, how-to guide | 400 | 398 | -0.5% | -0.1% | Stable |
| C, new guide | 300 | 520 | +73% | +4.9% | Growing |
Illustrative numbers. Slope per month = SLOPE() of 12 monthly click totals divided by their average.
Page A is the one that quietly costs you pipeline. A two-point report would mark it healthy.
As a starting point, flag a page when all of these are true. Tune the numbers to your site.
- It’s at least 12 months old.
- It averages enough clicks to matter. On most B2B SaaS blogs, that’s somewhere around 50 a month.
- Clicks are down 20% or more year over year, or the monthly slope is worse than minus 2%.
Judge decay on clicks first, with position and CTR as the diagnosis. Impressions alone mislead. A page can lose impressions on searches that never sent visitors and still gain clicks. And for pages close to revenue, add GA4 key events by landing page, because a page can hold its traffic while the visitors who used to convert go elsewhere.
Which decaying pages to fix first
Fix the decaying pages closest to revenue first, not the ones that lost the most traffic. A comparison page losing 60 clicks a month is usually worth more than a glossary page losing 300, because the comparison reader is weeks from buying and the glossary reader is weeks from caring.
Score each flagged page on two things: how close its reader is to a purchase, and how many clicks a refresh could realistically win back.
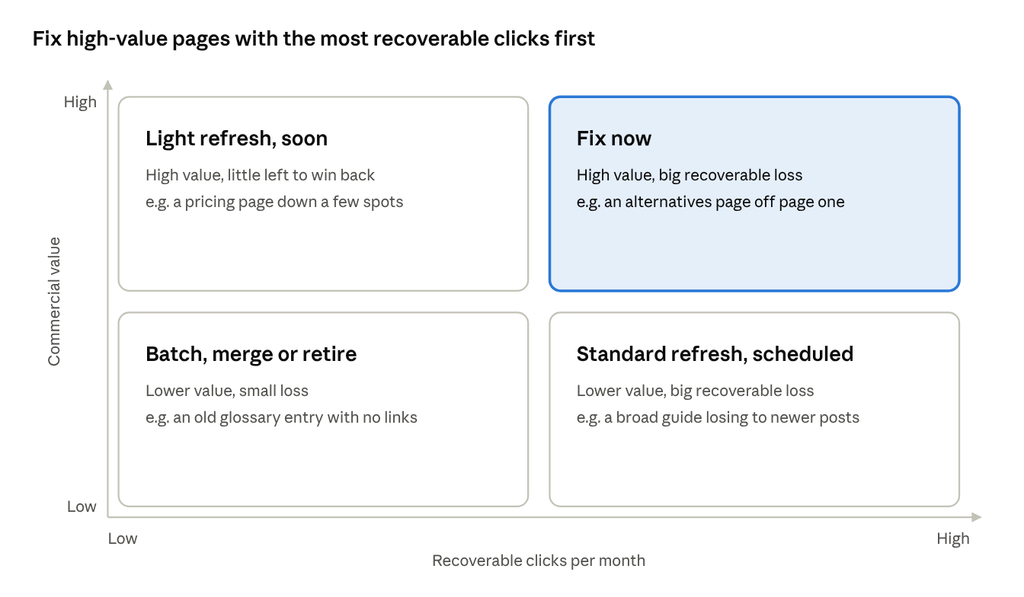
decay priority matrix · commercial value × recoverable clicks
To turn the grid into a ranked list, give each page a simple priority score:
\text{Priority} = \frac{\text{Recoverable clicks per month} \times \text{Value weight}}{\text{Effort in hours}}
- Recoverable clicks = the page’s best three-month monthly average minus its current three-month average. Leave out any loss you’ve traced to demand decay.
- Value weight = 3 for bottom-of-funnel pages (comparisons, alternatives, pricing, use cases), 2 for how-to content tied to your product, 1 for broad top-of-funnel content.
- Effort = your honest estimate for the refresh level the page needs, from the playbook below.
Worked through, the comparison page that lost 60 clicks (60 x 3 / 4 hours) scores 45. The glossary page that lost 300 (300 x 1 / 8 hours) scores 37.5. The comparison page goes first, and now you can show leadership why.
Demand decay sits outside the grid. If the searches themselves are disappearing, no amount of refreshing helps, so those pages go straight to the merge or retire decision.
Refresh, merge, redirect, or retire?
Most decaying pages should be refreshed, but not all of them. Use the page’s situation, not its traffic loss alone, to pick the action.
| Situation | Action | Watch out for |
|---|---|---|
| The query still matters and the page still ranks somewhere in the top 20 | Refresh | Keep the URL exactly as it is |
| Two of your pages split the same query | Merge into the stronger URL, 301 the weaker one | Move the weaker page’s best sections and any linked-to stats across first |
| The topic no longer fits your strategy, but the page has good backlinks | 301 to the closest relevant page | Never to the homepage. An irrelevant target wastes the links |
| No clicks in 12 months, no backlinks, no business value | Retire with noindex or removal | Noindex is reversible. Deletion isn’t |
| Demand fell, but sales or support still uses the page | Keep it, stop judging it on organic traffic | Move it out of your decay report |
| The page never matched intent in the first place | Rewrite from scratch on the same URL | Check the current SERP format before you outline |
After any merge or redirect, update internal links to point straight at the surviving URL. See Google’s redirect documentation.
When you merge or redirect, update every internal link to point straight at the surviving URL. Google’s redirect documentation covers which redirect types pass signals, but a chain of old internal links through a redirect is still a mess you made yourself.
Content decay vs. content pruning. Decay is the problem. Pruning is one possible answer to it, meaning you remove, noindex, merge, or redirect pages that no longer earn their place. Most decaying pages shouldn’t be pruned. A page that once ranked has already proven it can, and a refresh is usually the faster way back. Prune only when there’s no traffic, no links, no business value, and nothing better to merge into.
How to fix content decay
To fix content decay, match the size of the refresh to the type of decay, then work through the same checklist every time. A refresh is more than a new date, and it’s less than a rewrite in most cases.
| Refresh level | Typical time | What it covers | Best for |
|---|---|---|---|
| Light | 1 to 2 hours | Facts, prices, screenshots, title and meta description | Freshness and click decay |
| Standard | Half a day | Light, plus missing subtopics, new examples, internal and external links | Ranking decay |
| Full rewrite | 1 to 2 days | Rebuild the page in the format the SERP now rewards | Intent decay |
| Links | Ongoing | Reclaim lost backlinks, earn new ones, restore internal links | Link decay, and ranking decay on competitive terms |
Match the size of the refresh to the type of decay. Save a baseline before you change anything.
For a standard refresh, this is the checklist:
- Save a baseline first. Record the last 28 days and last three months of clicks, impressions, CTR, average position, and conversions, plus today’s date. Skip this, and you’ll never prove the refresh worked.
- Read the SERP again. Search the main query and study the top five results, the AI Overview, and the People also ask box. Note the format that wins, what they cover, and what they show that you don’t.
- Fix the format before the words. If the results are now lists and you have a guide, no amount of polishing will save the guide.
- Update every fact that changes. Prices, feature names, stats, screenshots. Link every number to its source.
- Add what nobody else has. Your own data, a real example, a screenshot from your own account, an opinion from experience. Google’s helpful content questions ask whether a page offers original analysis that goes beyond the obvious. That’s what a refresh should add.
- Answer first. Open with the direct answer to the main question, and give each key section a short, self-contained answer that an AI system could quote.
- Rewrite the title and meta description, especially for click decay. Give someone who’s already read the AI Overview a reason to click.
- Fix the links. Add internal links from three to five relevant pages, replace broken external links, and check whether the page lost backlinks it used to have.
- Keep the URL. Changing the slug during a refresh resets work you’re trying to protect.
- Change the date only for real changes. Google’s helpful content guidance treats changing dates on unchanged pages as a warning sign, and its byline date guidance asks that dates describe when the page was actually published or updated.
- Request indexing with the URL Inspection tool, and log the refresh date.
- Re-promote it. Send it to your newsletter, share it, and if an expert contributed, ask them to share it too.
Where AI fits in a refresh. AI is useful for finding the work: summarizing a Search Console export, listing subtopics competitors cover that you don’t, flagging stats that look old, and drafting title options. Keep humans on the parts readers judge you on. That means verifying every price and number, adding first-hand experience, deciding whether intent has changed, and making the merge or retire call. A refreshed page with a confidently wrong price is worse than the stale one.
How to measure a refresh (and prevent the next round of decay)
Measure every refresh against its saved baseline at 4, 8, and 12 weeks, and judge it on weekly or monthly trends, never a single day. One good Tuesday proves nothing.
There’s one step most teams skip: a control group. Pick a few similar pages you didn’t touch and track them over the same weeks. If the whole site rose 15% after a core update, a refreshed page that rose 15% didn’t recover because of your work. The control group tells you what’s yours.
Prevention is mostly a routine. Here’s one a small team can run:
| Cadence | What to do | Time |
|---|---|---|
| Monthly | Check your priority pages, last 28 days vs. the previous 28. Flag anything down 20% or more | About an hour |
| Quarterly | Run the full year-over-year audit and slope check across the site. Add new losers to the backlog | Half a day |
| Yearly | Refresh every “best”, pricing and comparison page, even if it isn’t declining yet | Varies |
| Every new post | Check whether an existing page already targets the keyword. Merge or differentiate before you publish | Ten minutes |
| Every refresh | Log the date, the changes, and the 4, 8 and 12 week results | Five minutes |
A routine a small team can run. Judge refreshes on weekly or monthly trends, never a single day.
A few habits make decay slower and cheaper to fix:
- Give every content cluster an owner. Without one, refreshes happen only when someone happens to notice.
- Plan the update when you publish. Put a review date on the brief, especially for pages with prices, product details, or a year in the title.
- Reserve capacity for refreshes. Set aside a fixed share of each month’s content budget for updates instead of spending it all on new posts. Every new page you publish is one more page you will need to maintain.
- Watch your links, not just your copy. Alerts for lost backlinks on your top commercial pages catch link decay months before it shows up as lost rankings.
- Put refresh results in the same report as new content. See clicks recovered and leads from refreshed pages side by side with new posts. That’s how refresh work keeps getting time.
A live dashboard helps with the monthly check. The free Search Console connector in Data Studio (formerly Looker Studio) can show clicks by page against the same period last year, so drops surface between audits.
Tools to detect content decay
Google Search Console covers the essentials for free. Paid tools mostly add competitor context, backlink data, and alerts across a large site.
| Tool | Best for | Cost |
|---|---|---|
| WizibleBuilt by us | Content decay and cannibalization alerts built on Search Console data | Free and paid plans |
| Google Search Console | Your real clicks, impressions, CTR and position by page and query. Every decay audit starts here | Free |
| Google Trends | Telling demand decay and seasonality apart from real decay | Free |
| Data Studio | A monthly decay dashboard with the free Search Console connector, no exports needed | Free |
| BigQuery bulk export | History beyond 16 months, and slope scoring across thousands of URLs | Pay for what you use |
| GA4 | Key events by landing page, so you see lost pipeline and not just lost clicks | Free |
| Ahrefs or Semrush | Lost backlinks, competitor pages that overtook yours, SERP changes over time | Paid |
| Screaming Frog | Ruling out technical lookalikes like noindex, canonical and redirect changes | Free up to 500 URLs, paid beyond |
Full disclosure: Wizible is built by Angleout’s founder. Third-party tools estimate rankings and traffic, so use Search Console for what actually happened to your pages.
Full disclosure: Wizible is built by Angleout’s founder. Remember that third-party tools estimate your rankings and traffic. Use them for context and competitors, and use Search Console for what actually happened to your pages.
Frequently asked questions about content decay
What is content decay in SEO?
Content decay in SEO is the gradual decline in a page’s organic clicks, rankings, or visibility after it has performed well. It’s usually caused by stronger competing pages, shifting search intent, outdated information, AI Overviews and other SERP features, lost links, or overlap with your own newer pages.
How do you measure content decay?
Compare each page’s clicks for the last three months with the same period a year earlier to get a decay rate. Then check the monthly trend slope across 12 months, because two dates can hide a page that’s been falling all year. Use position and CTR to work out why.
How long does it take a refreshed page to recover?
It varies by page and by how competitive the query is. Google says some changes take effect in days and others take months. Check results at 4, 8 and 12 weeks against your baseline before you decide whether the refresh worked.
Does changing the publish date help SEO?
Not on its own. Google’s guidance lists changing dates on pages that haven’t substantially changed as a warning sign. Update the visible date after a real refresh, so readers can see the information is current.
How is content decay different from a Google algorithm update?
Content decay happens slowly on individual pages over months. An algorithm update usually moves many pages within days. If traffic fell across your site on a specific date, check Google’s ranking update history before treating it as decay.
Should you delete content that’s losing traffic?
Only when it has no traffic, no backlinks, no business value, and no stronger page to merge into. In most cases, refreshing the page or merging it into a stronger one keeps the rankings and links it has already earned.
Start with the pages closest to revenue
Content decay will hit every page you publish eventually. The only question is whether you catch it at minus 20% or minus 80%. Start this week: run the year-over-year comparison in Search Console, score your top losers by commercial value, and refresh the first one on the list.
If you’d rather hand it off, Angleout runs content decay audits for B2B SaaS teams, from diagnosis and prioritization to the refresh and the links that help a page win back its spot.
47 checkpoints across technical, content, and conversion — the same list our strategists run on every new account.